The Research Risk Cascade: Why Even “90% Accurate” AI Tools Break Pipelines
By Lindsey DeWitt Prat, PhD
Director, Bold Insight
January 2, 2026
Tools marketed as AI are stacking up in qualitative research workflows faster than we can evaluate them—as individual components or bundled sets. Research is a pipeline, not a bucket. Errors cascade, transform, and compound as they move from transcription through translation to synthesis and analysis. A pipeline that looks “good enough” at each stage can produce insights that look solid but drive bad decisions.
Here I introduce the Research Risk Cascade framework and models how signal degrades across three language pipelines: Standard American English (70% retention), French-English (46% retention), and Hindi-English (35% retention). Without measurement, technical debt becomes insight debt.
Making pipelines visible is the precondition for meaningful evaluation. The measurement infrastructure exists. The question is whether we’ll use it before cascading failures become embedded—and invisible—practice.
-
AI tools, platforms, and models are proliferating across qualitative research. In user experience and customer research alone, well over a hundred now compete for the pipeline. They’re marketed under the catch-all “AI” despite representing fundamentally different technologies: automatic speech recognition (ASR), machine translation (MT), large language models (LLMs), etc. The promises are ambitious. 10× productivity! Qual research at quant speed and scale! Research across 180+ languages, no human translators (or researchers) required! “The Best Transcripts You’ve Ever Seen” (an actual ad). The market has grown faster than our ability to evaluate it, and it isn’t slowing down. The advances in technology and tooling are real, and the gains are demonstrable. But so are the losses.
So what are we losing? We’re definitely losing visibility—into how these tools work, and how well they work. Visibility is a precondition for evaluation. “AI research assistance” is sold as modular components—commonly a transcription service, a translation layer, a large language model (LLM) for higher-order “thinking” tasks—or, increasingly, as turnkey solutions. Individual components might come with 90% accuracy claims; bundled platforms might promise trust and reliability. But the claims are opaque, based on internal benchmarks and proprietary evaluations that can’t be independently verified or replicated in actual research contexts. ASR, MT, and LLMs fail in different ways, on different inputs, by different metrics. A single accuracy number tells you almost nothing about where your pipeline is exposed.
No matter the configuration—modular or bundled—the trend across research tech stacks is toward tighter integration and less visibility. Convenience is attractive, but it’s never free. Chaining these technologies together masks the errors that exist at each stage. Research is a pipeline, not a bucket, and errors multiply rather than accumulate. I call this phenomenon the Research Risk Cascade.
Cascading risk is well documented in fields like systems engineering, finance, public health, and high-reliability organizations. The contexts differ, but the mechanics are shared: in tightly coupled systems, small failures produce outsized downstream effects. Nithya Sambasivan and colleagues documented this pattern in AI and machine learning (ML) as “data cascades.” Their CHI ’21 Best Paper, titled “Everyone wants to do the model work, not the data work,” studied data cascades across AI/ML projects in multiple domains and countries. Failures were hard to detect and expensive to fix because problems surfaced late, long after the original data decisions. Teams got stuck in reactive cycles, repeatedly launching and adjusting based on confusing signals. The ones with fewer cascades shared a pattern: frequent pipeline runs, close collaboration with domain experts, careful documentation, and continuous monitoring. Ninety-two percent of projects they surveyed had cascades, but most could have been prevented. Prevention meant shifting away from reactive cleanup that treats data work as “grunt work” and towards proactive data excellence.
That framing should sound familiar. “Grunt work” has become a common shorthand in the marketing of AI tools, used to promise relief from slow, manual, and repetitive parts of research. The promise is not trivial. Automation does reduce friction. But applying it across the full pipeline with little oversight—or none at all—treats research as a solvable technical problem. It isn’t.
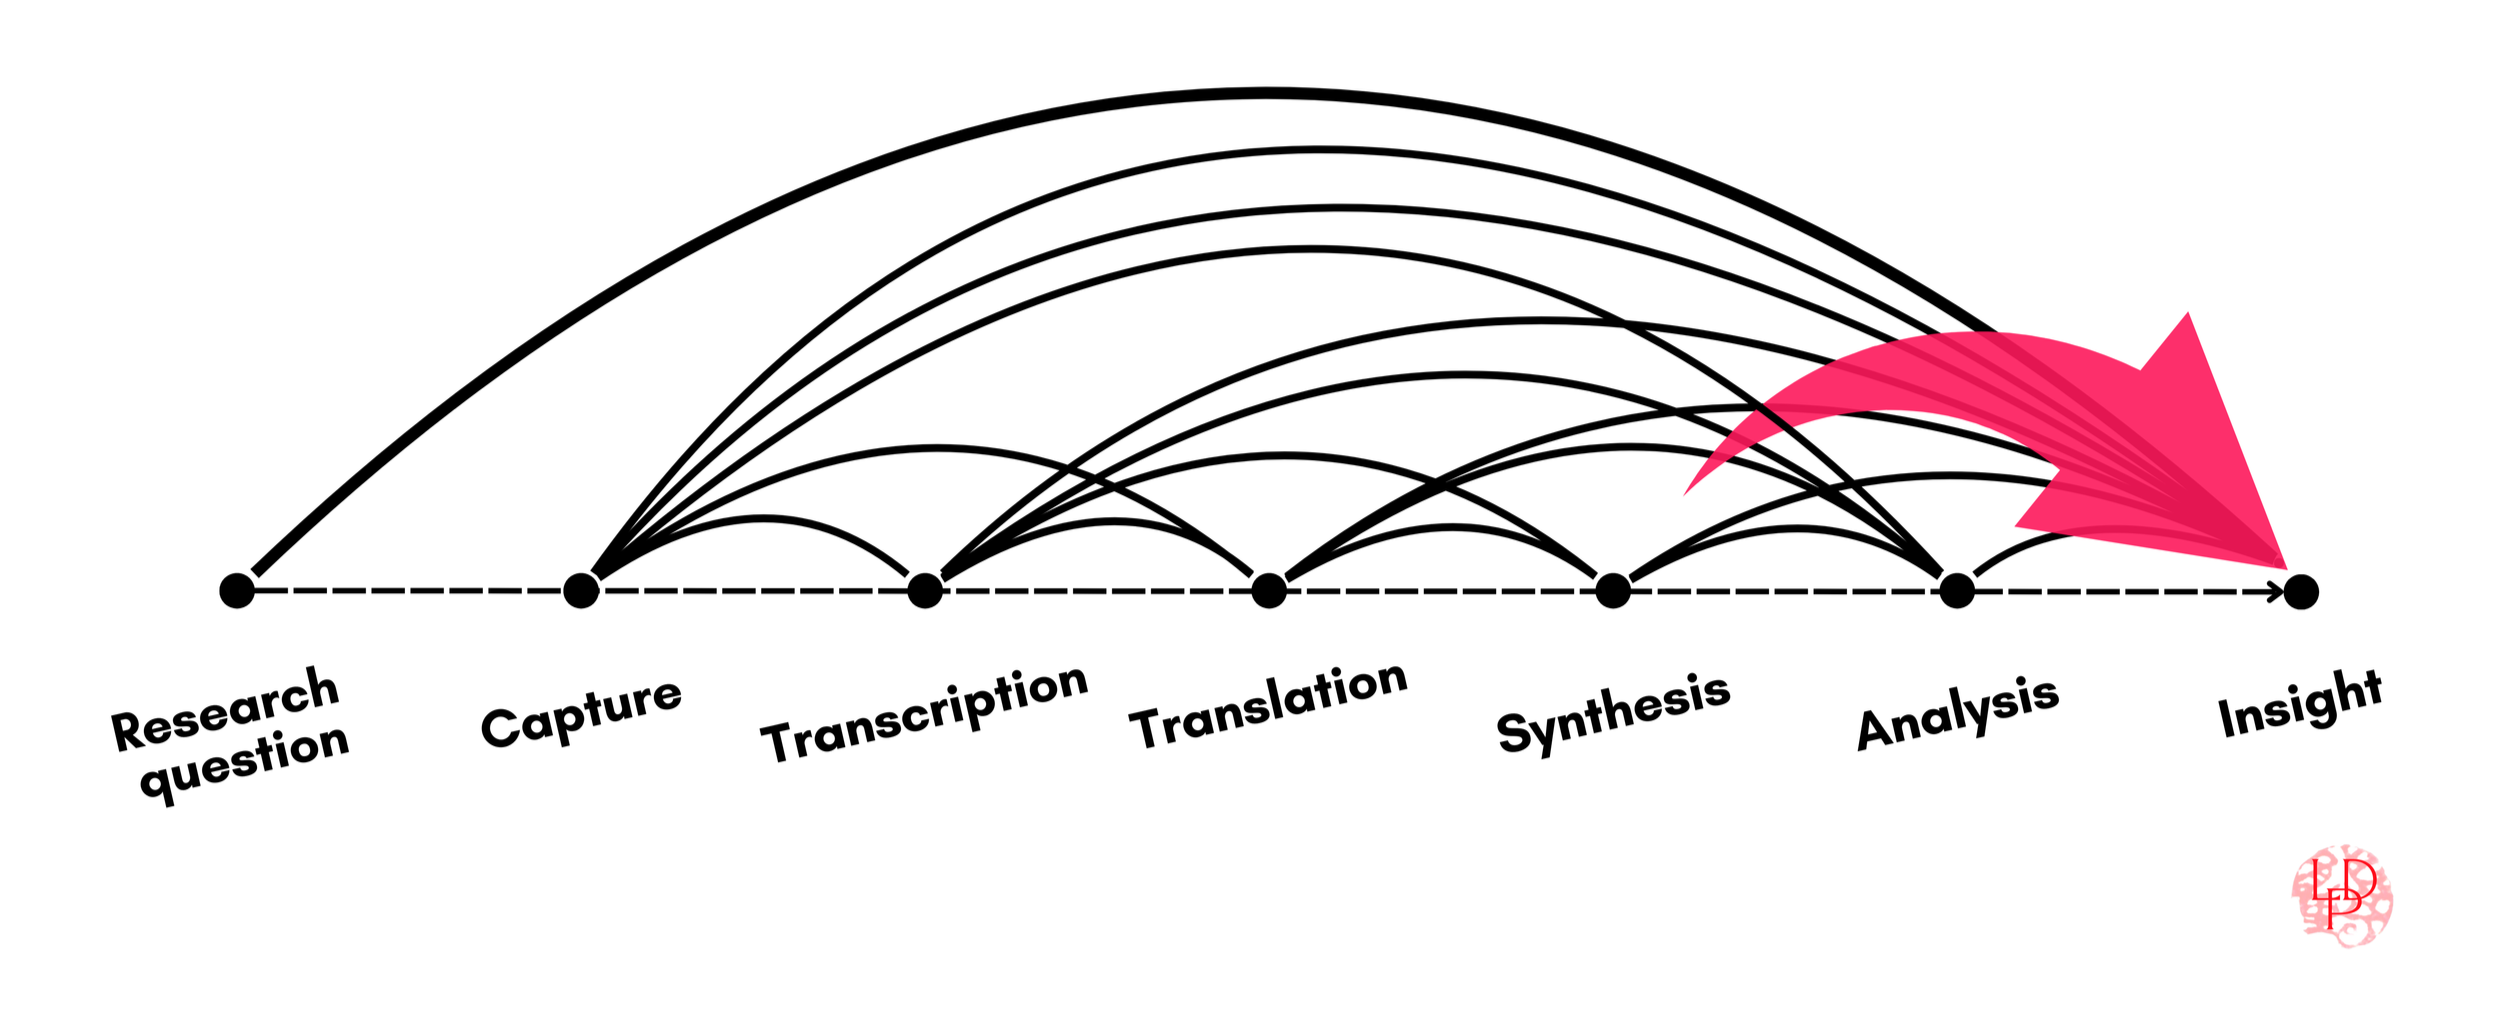
The Research Risk Cascade applies complex risk thinking to qualitative research pipelines. Instead of the sensor data, labeled images, and log files in AI/ML pipelines, the qualitative research pipeline begins with lived experience and converts it into digital artifacts and, ultimately, decisional tools through a familiar chain of transformations:
Capture → Transcribe → Translate → Synthesize → Analyze → Insight
Each step inherits what came before and reshapes it. Loss is possible at every stage—some degree of it nearly certain—and that loss compounds into non-linear impacts that are more than the sum of the original parts (see figure 1). Transcription narrows what is available to translate. Translation filters which meanings survive to synthesis. Synthesis can flatten variance, suppress outliers, and smooth contradictions. Analysis proceeds on outputs that appear fluent and tidy, even when their structure has already thinned. The signal continually degrades, but the degradation becomes harder to detect as it moves downstream toward insight. Et voilà, technical debt becomes insight debt.
Insights are not merely outputs. Insights require interpretation. Battle and Ottley (2023) define insight as the intersection of two types of knowledge: analytic knowledge derived directly from data, and domain knowledge that provides context beyond the dataset. The more you delegate pipeline stages to AI tools, the harder it becomes to maintain both sides of this intersection. Signal degradation erodes analytic quality, while automation distances you from the domain knowledge needed for interpretation. You get answers, but those answers are easier to produce than they are to trust. Information, yes, but insights? The costs show up later, as distorted understanding and fragile decisions, and as societal harms.
-
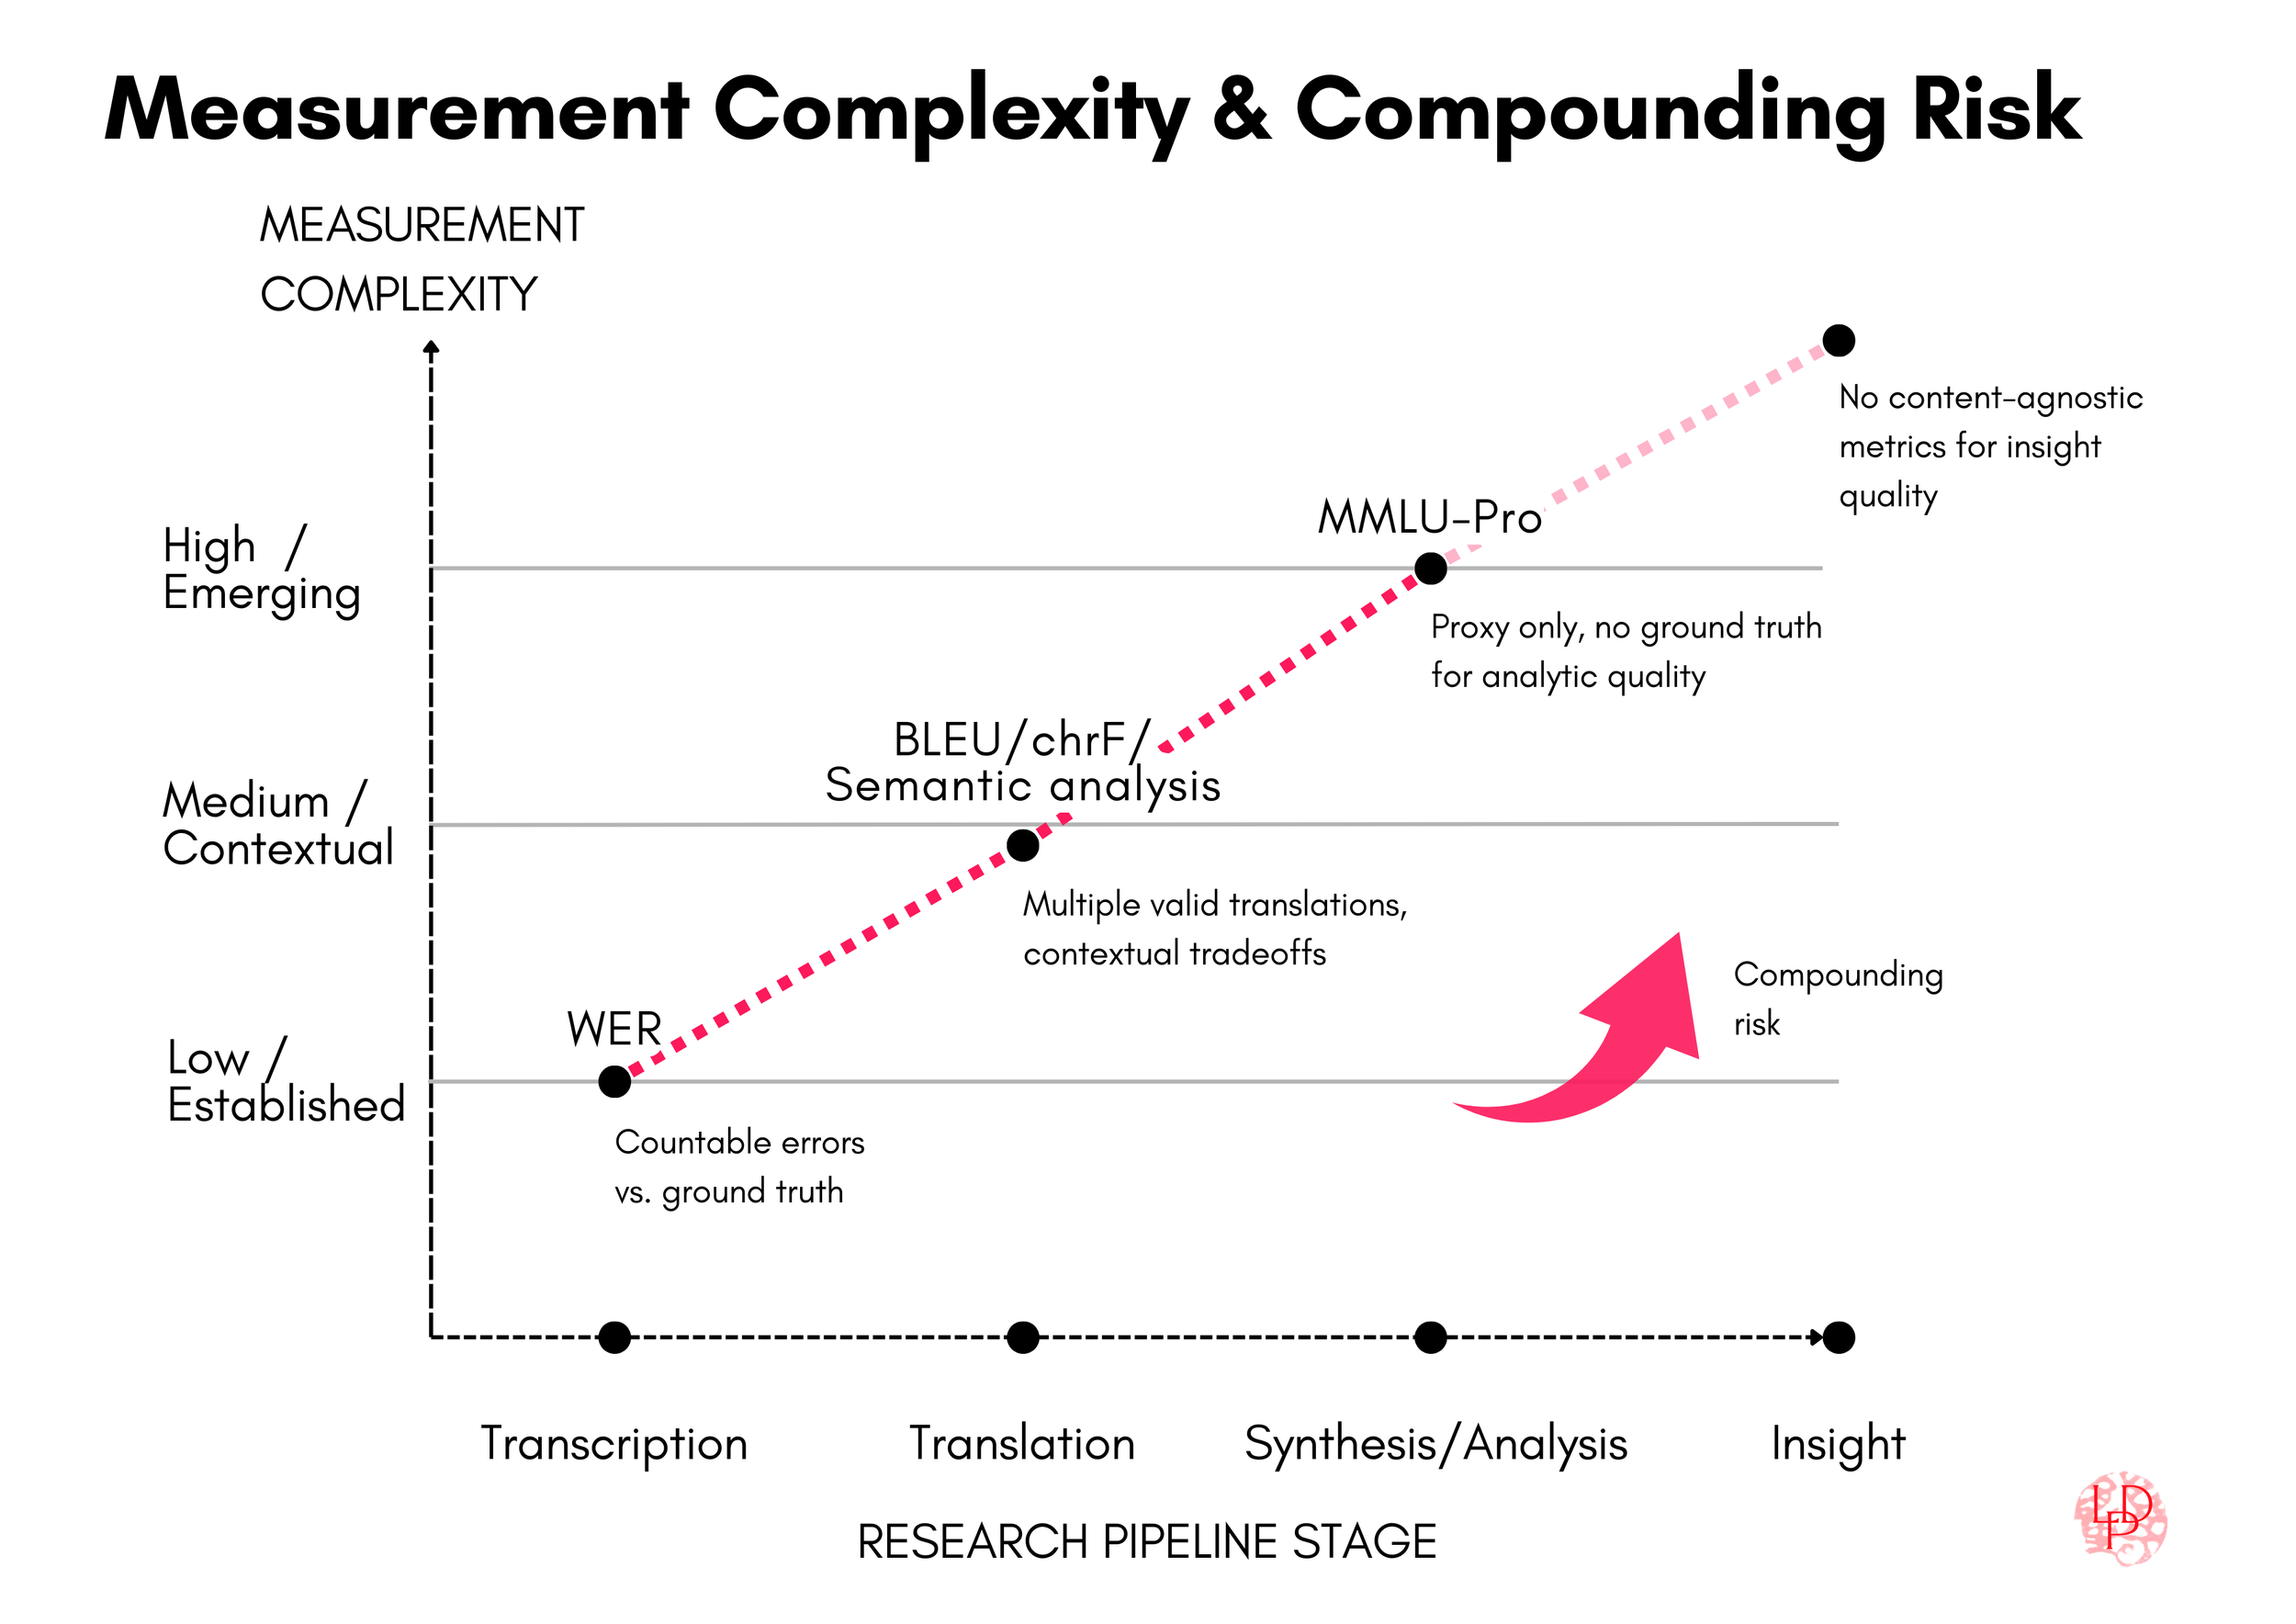
To track Research Risk Cascades, we need measurement points. The early stages of the research pipeline offer established measurement points and metrics that are imperfect, but long-standing and informative. Synthesis and analysis are harder to measure with standard metrics, but equally important to evaluate. This section introduces several metrics at each stage of the research pipeline and discusses their strengths and caveats.
Transcription can be evaluated using Word Error Rate (WER), which has been the standard metric for ASR since the 1980s. WER counts substitutions, deletions, and insertions at the word level. It’s a blunt instrument that treats all errors as equivalent regardless of their impact on meaning. Features like prosody, hesitation, overlap, or interactional features that qualitative researchers often care about are invisible to WER. But it gives a baseline number for how much of the original signal made it through. More recently, Token Error Rate (TER) has been proposed as a complementary metric for neural and LLM-based ASR systems. TER accounts for tokenization differences and can better reflect how errors propagate in downstream Natural Language Processing (NLP) tasks. TER doesn’t solve WER’s core limitations, but it’s useful when transcription output feeds into further automated processing rather than human-only reading.
Translation quality is often approximated using reference-based metrics such as BLEU, METEOR, chrF, and COMET. BLEU, METEOR, and chrF rely primarily on surface-form overlap between machine output and human translations, comparing shared words or character sequences. These metrics are well known to be limited: they miss meaning shifts, flatten cultural and pragmatic context, and penalize valid alternative translations. BLEU in particular has been criticized for decades, yet it persists because it is fast, reproducible, and gives teams something to compare against. COMET differs in that it is a learned, neural metric trained on human judgments, and while it correlates better with adequacy, it remains constrained by reference translations and inherits their blind spots.
Researchers have developed complementary approaches that attempt to assess meaning preservation more directly. Semantic analysis methods derive meaning representations from text to evaluate whether core semantics survive translation, often using embedding-based comparisons like BERTScore or transformer-based semantic similarity measures. Back-translation (or round-trip-translation) approaches evaluate whether translating content into a target language and back to the source preserves the original message. LLM-as-judge methods are increasingly used to assess correctness. None of these approaches are perfect: embedding-based metrics depend on model quality, back-translation can mask certain error types, and LLM-based evaluation passes on the judge model’s biases. But they often bring out different performance patterns than overlap metrics alone, particularly for morphologically rich languages or those with substantial linguistic distance from English, as we’ll see below.
Why the divergence between overlap scores and semantic measures? Measuring translation quality is orders of magnitude harder than transcription because meaning is contextual, languages are incredibly diverse, and translation itself involves fundamental tradeoffs. A big one is the tradeoff between naturalness and accuracy. Optimizing for one aspect sacrifices the other. Neural Machine Translation (NMT) systems tend to privilege literal accuracy, which often results in stiff or unnatural output. LLMs can produce more natural-sounding translations, but they do so by “interpreting” context, which means outputs that may extrapolate, smooth over ambiguity, or introduce things that weren’t present in the source text. As a longtime Japanese–English translator, I can confirm: the translational tensions and the choices are real. The choice of translation system bakes in which errors you’ll have to tolerate, not whether errors will occur. All translation tools require cleanup depending on what you’re after: passable gist, idiomatic and elegant prose, or verbatim accuracy for high-stakes contexts like healthcare or legal work.
As research progresses toward synthesis and analysis, measurement becomes more complex still. Unlike transcription and translation, which have established metrics like WER and BLEU, synthesis and analysis lack standardized benchmarks. There’s no simple score for “accurately identified patterns” or “produced valid insights.” However, LLM evaluation benchmarks can provide a directional floor—a lower bound on capability that helps us understand what these tools can and cannot reliably do.
The MMLU (Massive Multitask Language Understanding) dataset and multilingual counterparts like MMMLU (produced by OpenAI) and Global MMLU Lite (produced by Cohere) test “reasoning” capabilities across subject areas and languages, ostensibly similar to tasks synthesis and analysis require. Model builders report their scores on these benchmarks, and independent evaluators use them to track reasoning performance. But MMLU and its variants are severely limited: they test recognition more than generation, favor certain knowledge domains like math, are heavily Western-centric, and can be gamed. MMLU scores have saturated—models now exceed 90% accuracy—driving migration to harder variants like MMLU-Pro, with Pro+ already proposed.
Synthesis and analysis resist definitive measurement because they’re always shaped by interpretation, context, and domain knowledge. No benchmark captures that. But we need to start somewhere, and current LLM benchmarks provide useful anchors. For the modeling exercise that follows, I use MMLU-Pro scores as proxies for synthesis and analysis performance. These scores reflect what model builders currently optimize for, making them relevant—if imperfect—measures of actual system capability.
From WER to BLEU & co. to MMLU-Pro, we now have measurement points across the pipeline. Now we can also start to track two connected challenges: measurement difficulty increases at each stage, while errors cascade and compound through the pipeline (see figure 2).
These metrics are provisional starting points, not measures of research validity. Content-agnostic metrics like WER and BLEU provide foundations, but domain-specific quality requires context-appropriate evaluation. For translation, newer approaches like semantic analysis and back-translation with LLM-as-judge sit at higher measurement complexity than overlap metrics, as they aim to capture meaning preservation more directly, though with their own limitations and dependencies. The need for context-appropriate evaluation becomes even more critical at synthesis, analysis, and insight. While benchmarks like MMLU-Pro offer directional proxies for reasoning capability, they measure generic performance rather than research validity. Building evaluations specific to your research context—your domain, your questions, your quality standards—is essential work. (More on that soon.)
Even with their limitations, these borrowed metrics are sufficient to model how signal degrades and compounds through research pipelines.
-
To make the risk cascade concrete, let’s now model how loss compounds across pipelines for three language pairs. The capture rate (.99) is simplified to account only for minor audio issues. Transcription and translation rates are averaged from upper and lower bounds in independent benchmarks and peer-reviewed work; synthesis and analysis rates reflect current industry evaluation standards. These three pipelines are modeled to illustrate the best-case (Standard American English), a well-resourced multilingual pair (French–English), and a lower-resourced, high-complexity pair (Hindi–English).
-
Standard American English (SAE) is the baseline here, the variety most AI models and tools are optimized for. Not African American Vernacular English (AAVE) or Australian Aboriginal English. Not any of the many other Englishes spoken worldwide, and not non-“standard” dialects or accents. Even in this best-case scenario, the pipeline shows measurable loss.
For transcription, the AA-WER Index (2025) shows commercial ASR systems achieving 7.7–13.2% WER on benchmarks that include messy conditions: noisy meeting recordings, overlapping speakers, and distant microphones. The Open ASR Leaderboard tests open models across multiple speech types, with top performers approaching ~5% average WER. But even these benchmarks are cleaner than typical qualitative research interviews with their overlaps, hesitations, and ambient noise. The midpoint of the commercial range (10.5%) gives us a transcription estimate of .91 accuracy for our working model, though it likely overstates real-world performance.
Recent empirical work confirms the gap: Camille Harris et al.’s 2024 study examining ASR performance on podcast data—still more polished than typical research interviews—found the lowest WER for SAE across models to be nearly 25%. That same study showed a WER 2–3x that for AAVE, Chicano English, and Spanglish. Let that sink in: some varieties of English widely spoken in the US can experience WER approaching 75%, losing three-quarters of signal fidelity at transcription alone.
For synthesis and analysis, MMLU-Pro leaderboards (Hugging Face, Kaggle, Artificial Analysis) show the latest models (as of late December 2025) clustering in the high-80% range. We’ll use .88 as a conservative midpoint for modeling purposes here, recognizing that these benchmarks measure generic “reasoning” capability, not the intersection of analytic and domain knowledge that defines research insight.
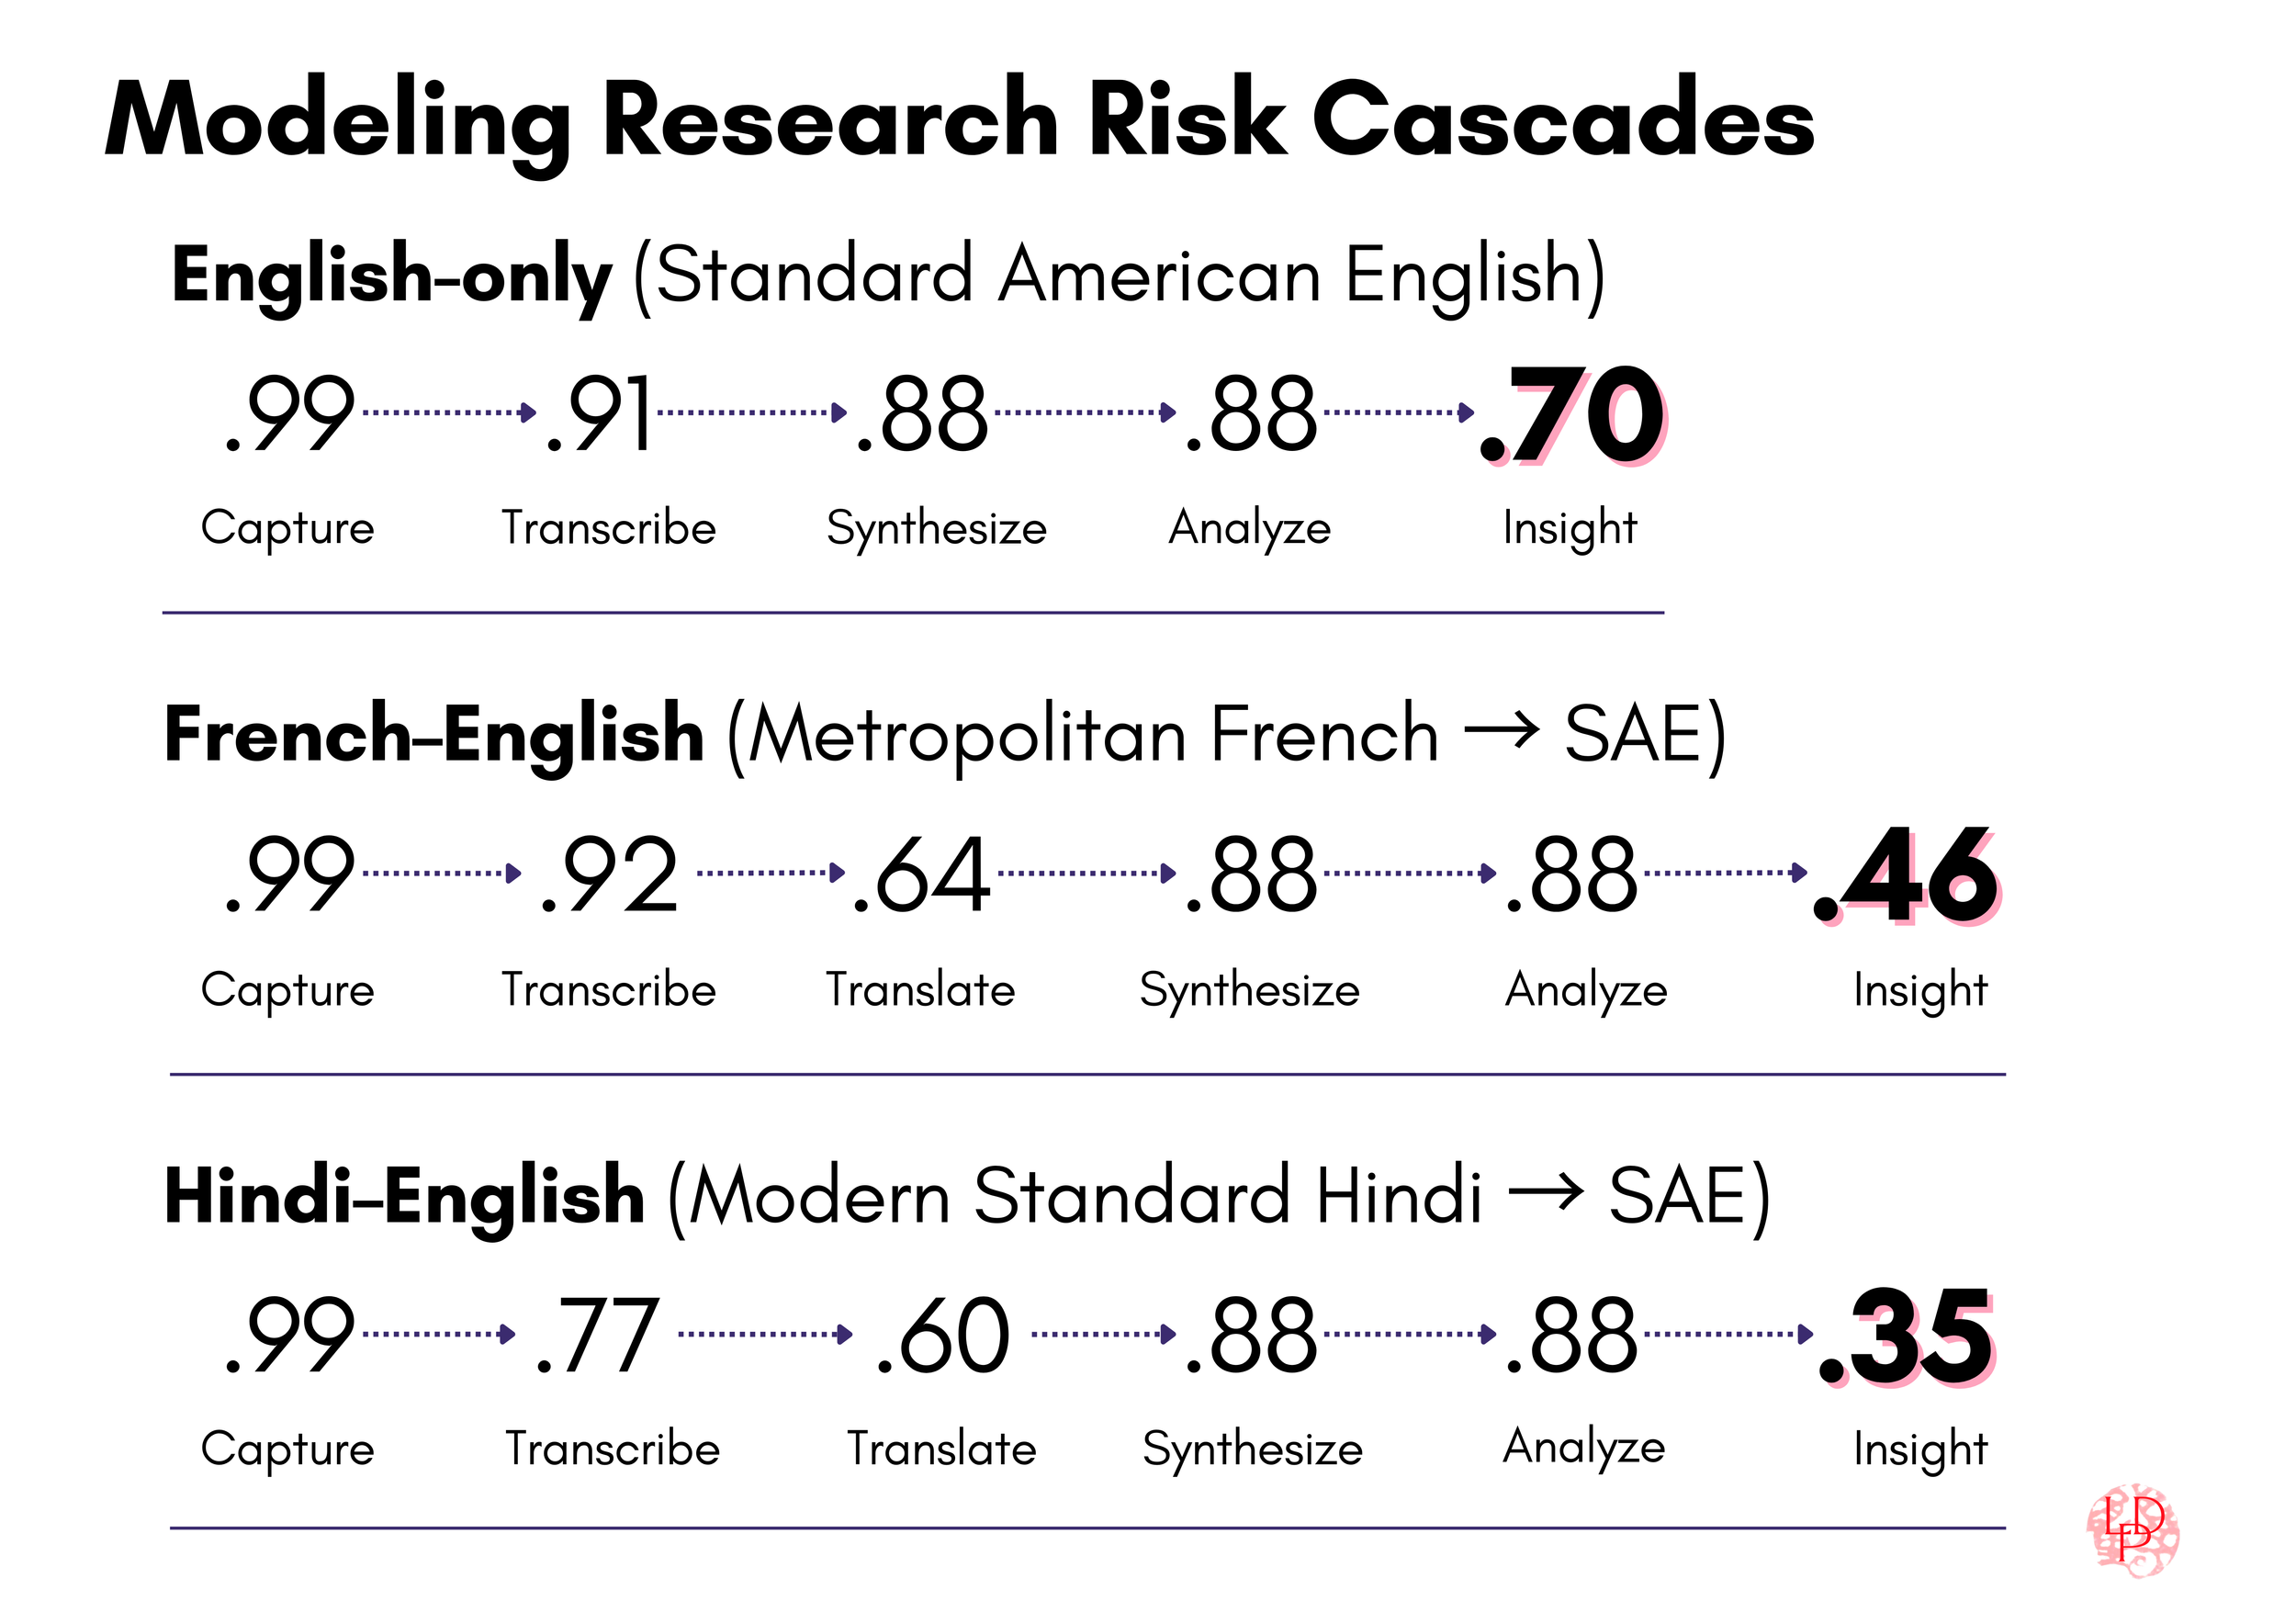
Multiply across stages: a best-case English-only pipeline might lose 30% of signal before the insight stage (figure 3).
Capture (.99) × Transcribe (.91) × Synthesize (.88) × Analyze (.88) → Insight ≈ 70%
-
French–English is one of the best-supported language pairs in AI tools, with extensive training data and strong benchmark coverage. Here, as with SAE, we consider only “Metropolitan French” (spoken in Paris and considered standard), not any local or global variants.
For transcription, LLM-based ASR models on the Open ASR Leaderboard report WER for French in the ~5–6% range. The commercial ASR systems many researchers use cluster around 10% WER: AssemblyAI classifies French as high accuracy (≤10% WER) for their Universal speech-to-text model, and Deepgram reports “upwards of 90%” accuracy depending on use case. More traditional ASR systems evaluated independently (e.g., Kaldi) show higher error rates, closer to ~13% WER. As with English, lower figures reflect performance on curated speech datasets rather than long, conversational qualitative interviews. Averaging across these published figures, with weight toward the commercial tools researchers use, gives us approximately .92 accuracy.
For translation, quality measurement depends heavily on methodology. Overlap-based metrics (BLEU, GLEU, chrF, METEOR) capture surface-form alignment but penalize valid paraphrase. In a 2024 multilingual benchmark using sentence-level TED talk data, French–English translation averaged around 40% across these four metrics for both Google Translate and GPT-based models. The spread is systematic: chrF and METEOR (metrics more sensitive to meaning) clustered in the mid-50% range; BLEU and GLEU scored substantially lower.
Semantic analysis estimates paint a different picture. Solatorio et al. (2025) evaluated translation using LLM-judged back-translation correctness, finding GPT-4o achieved approximately 85% correctness zero-shot, rising to nearly 90% with chain-of-thought prompting. These divergent results—40% overlap versus 85% semantic correctness—reflect a consistent profile: French–English translation degrades lexical form substantially while often preserving core meaning. For pipeline modeling, we weight these estimates toward semantic retention given qualitative research’s interpretive goals, using 64% as a conservative middle ground that acknowledges both surface degradation and maintained adequacy.
Once translated into English, text enters English-language models for synthesis and analysis, making English benchmarks relevant reference points despite upstream degradation. Multilingual benchmarks attempt to measure cross-language reasoning: MMMLU shows open-source models reaching around 81% on French content, while Global MMLU Lite shows proprietary models approaching 93%. But these comparisons are problematic: they treat English as a ceiling when English scores never reach 100%, and they measure isolated language capability rather than signal preservation through an already-degraded pipeline.
For this modeling exercise, we’ll use the same .88 MMLU-Pro rate we applied to the English scenario. This choice prioritizes consistency over false precision, recognizing that these benchmarks measure generic reasoning, not whether contextual meaning survives the pipeline’s transformations.
Multiply across stages: a French–English pipeline might retain only 46% signal by the time you reach insight, more than half lost to cascading transformations (figure 4).
Capture (.99) × Transcribe (.92) × Translate (.64) x Synthesize (.88) × Analyze (.88) → Insight ≈ 46%
-
Hindi–English pipelines—here meaning (Modern Standard Hindi in Devanagari script to SAE)—have a fundamentally different risk profile. Despite over 600 million speakers worldwide, Hindi accounts for well under 1% of indexed web content. The imbalance does more than just degrade accuracy; it creates a “double jeopardy” for Hindi and other non-English speakers, especially in the Global Majority. In this scenario, users in lower-middle-income countries face a dual burden: they are charged a tokenization premium (i.e., costs to access APIs reaching up to six times higher than for English) and simultaneously receive suboptimal model utility and lower performance. In other words, risk cascades in many global contexts are both technical failures and socioeconomic taxes. Add to this wide regional accent variation, pervasive Hindi–English code-mixing (“Hinglish”), and inconsistent script usage (Devanagari and Romanized Hindi), and you have a perfect storm: models with minimal exposure to real-world Hindi meeting maximal linguistic complexity. That gap shows up immediately in transcription and compounds through translation and beyond.
For transcription, performance varies widely depending on accent coverage, code-mixing, and dataset design. On Indic ASR benchmarks such as LAHAJA (multi-accent, conversational speech), baseline open models show WER for Hindi in the 20–30% range, with some configurations exceeding 30% WER. The strongest IndicASR models, trained on large and diverse Hindi datasets, can reduce WER to the mid-teens (~14–15%), but these are specialized systems rather than the generic ASR used by many research platforms. Commercial providers show wide variation in their claims: AssemblyAI classifies Hindi as “Good accuracy” (>10% to ≤25% WER), ElevenLabs claims less than 5% WER (which would make it better-performing than English if true!), while Deepgram announced improvements in Hindi in December 2025 but provided no specific figures. None of these commercial claims include methodology. Weighting peer-reviewed WER benchmarks over vendor claims, we can conservatively model Hindi transcription accuracy at approximately 0.77.
Two contextual notes reinforce the conservativeness of this estimate. For Hindi–English code-mixed speech (“Hinglish”), standard WER understates failure. Another performance metric, Mixed Error Rate (MER), a variant of WER designed specifically for code-switching contexts, shows substantial degradation even in state-of-the-art models: 29% loss in the best case after substantial in-domain fine-tuning on pretrained Whisper Large-V2. A different but related form of linguistic variation shows a smaller yet still meaningful loss: Kunisetty et al., 2025 reports that a Whisper-Medium model trained on ~170 hours of Indian-accented English achieves 15.08% WER. Accent variation alone degrades transcription quality, while native Hindi and code-mixed speech impose substantially higher error.
For translation, performance degrades substantially relative to high-resource European languages. In the same 2024 multilingual benchmark, Hindi–English translation achieved mean overlap scores of approximately 26% (GPT-based models) and 31% (Google Translate) across BLEU, GLEU, chrF, and METEOR—substantially lower than 40% for French. Meaning-sensitive metrics reached the low-to-mid 40% range, but remained well below French’s mid-50s performance.
Semantic analysis and back-translation studies show more variation. Solatorio et al. (2025) found GPT-4o achieved approximately 61% back-translation correctness zero-shot, rising to 67% with chain-of-thought prompting. Chandra et al. (2025) report semantic similarity around 75% for GPT-4o, though with wider variance than high-resource languages (Google Translate scored closer to 68%). These findings track with my own reported in the 2023 Bold Insight Global AI Study, which evaluated streaming Hindi audio translation under real research conditions and found approximately 63% preservation relative to expert human translation. Synthesizing across methodologies—overlap metrics (~30%), back-translation correctness (61-67%), semantic similarity (68-75%), and applied research conditions (63%)—we’ll use 60% as a working estimate that balances these convergent signals while acknowledging measurement uncertainty for lower-resourced languages.
For synthesis and analysis, we use the same .88 MMLU-Pro rate, anchored to English-language benchmarks. But again, by this stage the data has already passed through transcription with elevated WER and translation from a lower-resourced language.
Multiply across stages: a Hindi–English pipeline might retain only 35% signal by the time you reach insight. That’s nearly two-thirds lost to cascading transformations (figure 5).
Capture (.99) × Transcribe (.77) × Translate (.60) x Synthesize (.88) × Analyze (.88) → Insight ≈ 35%
-
Models and calculations help us understand risk structurally, at scale. But we live in particulars. How does the Research Risk Cascade play out in real work? Some failures make headlines, but most swirl about quietly in everyday work done by millions: analyzing interviews, processing customer feedback, synthesizing market research, making sense of lived experience. Here are four scenarios.
Say you’re on a product team analyzing feedback on a redesigned checkout flow. Transcription systematically drops hedging: “I think maybe the button should be…” becomes “I think the button should be.” Synthesis collapses twelve tentative suggestions into “users prefer.” Analysis concludes the team has clear direction. The team ships with confidence. Conversion drops 8% because users weren’t expressing button preferences at all. They were signaling uncertainty about the entire approach.
Or healthcare research. You’ve just conducted patient interviews to explore side effects of a new medication. Transcription filters out frequency markers like “rarely” and “sometimes” as conversational filler. Translation shifts “I had to stop because…” to “I stopped.” Synthesis treats discontinuation as uniform. The safety report frames this as patient preference rather than adverse events requiring intervention. Six months later, continuation rates are 30% lower than projected, and the real side-effect profile finally surfaces through pharmacovigilance.
Global product research. Imagine a US-based fintech company conducting user research in India to understand why their payment app isn’t gaining traction with small business owners. Interviews are conducted in Hinglish. Participants naturally code-switch between Hindi and English, especially for financial and technical terms. Transcription struggles with code-switching. “Maine payment request bheja” (“I sent a payment request”) becomes fragmented, with Hindi portions dropped or phonetically mangled. Key phrases like “bharosa nahi hai” (“there’s no trust”) are transcribed as gibberish or omitted entirely. By this point, the cascade is already underway. Translation happens on already degraded text, smoothing over the gaps. Cultural concepts do not transfer cleanly. “Setting,” a colloquial term used by a few participants to describe an informal arrangement or workaround within existing business relationships, gets translated as “setting up” and contextually stripped. References to cash-based trust networks and relationship-based credit get flattened to “prefers cash.” Synthesis compresses 30 interviews into five themes: UI confusion, feature requests, trust issues, competition, and cash preference. The analysis concludes users want better UX and offline mode. The product team ships an improved interface and offline sync. Adoption stays flat. Eighteen months later, on-the-ground research exposes the real issue: users don’t trust digital-only transactions for business payments because they can’t reconcile them with existing informal credit relationships and social accountability systems. The word bharosa appeared repeatedly in the original interviews, but never made it past transcription.
In strategy and market intelligence, the risk cascade could look like this: Your team conducts market research on competitor positioning. You feed all your sources and transcripts into a RAG-based LLM, which compresses 100 documents and fifty customer perspectives into the five themes optimized for executive readability you asked for. Three interviews flag unusual procurement patterns but aren’t included in the output because they’re statistically insignificant. Six months later, a competitor launches a freemium tier that destabilizes the entire segment. Traces of the unexpected move were there all along in the unqueried variance.
The ultimate output of a weakened pipeline is rarely obvious gibberish. Many distortions are subtle and systemic. Cultural context begins to drop away during transcription and translation, and thins further through synthesis and analysis. Uncertainty gets stripped out. Hedging disappears. What remains sounds plausible, helpful, and confident but carries systematic errors researchers have termed “careless speech.” Merriam-Webster’s selection of “slop” as its 2025 Word of the Year captures the volume problem: digital content of low quality produced in quantity by artificial intelligence. But the term misses the insidiousness. Pipeline degradation in qualitative research produces outputs that look professional, read smoothly, and mask their errors behind confidence.
Multiplied across fields and organizations, isolated leaks become a meta-cascade: an ocean of homogeneous, erroneous output. The Artificial Hivemind study demonstrates this convergence at scale, with models producing increasingly similar outputs regardless of task or context.
-
Over the past few years, researchers have increasingly scrutinized how AI systems are evaluated. In 2021, Sambasivan and colleagues gave us Data Cascades, observing that “everyone wants to do the model work, not the data work.” That same year, Raji and colleagues showed how common evaluation benchmarks are often treated as general measures of capability they were never designed to capture. Two 2025 studies—both titled “Measuring What Matters”—approach the same problem from different angles. Andrew Bean and colleagues reviewed 445 LLM benchmarks from leading NLP and ML venues and show that most lack basic construct validity. Shalaleh Rismani and colleagues demonstrated how current ethical AI evaluation practices assess individual components in isolation while missing how harms emerge from interactions across the full system.
The phrase “Measuring What Matters” has deeper roots, too. In the 1970s, Goodhart’s Law and Campbell’s Law independently articulated the same problem: when metrics become targets, they lose their meaning. Marilyn Strathern later crystallized it: “When a measure becomes a target, it ceases to be a good measure.” John Doerr’s 2018 Measure What Matters brought the idea to modern organizations, calling for attention to a few metrics that actually drive progress, not the dozens that are just easy to count.
For qualitative research pipelines, the parallel is clear. After all, everyone wants to do the insight work, not the workflow work! That mindset makes it easy to stack AI tools across the pipeline without measuring their combined effects. The Research Risk Cascade framework makes component parts visible so they can be measured.
Mitigating risk starts with making pipelines visible. Map every stage where anything called AI touches your data, from capture through insight. Identify the handoffs where signal degrades. Determine what your research absolutely cannot afford to lose—that definition shapes everything that follows. Use established metrics where they exist, then validate against your actual context. Check what generic benchmarks miss. Recognize that synthesis and analysis are never neutral: every compression choice shapes what becomes visible downstream.
This is collective work. We need shared language for pipeline health and shared standards for when AI delegation strengthens research versus when it undermines it. The measurement infrastructure exists for early pipeline stages. The challenge is extending it downstream and using it consistently. The cascades are already running in research pipelines everywhere.
Suggested citation: DeWitt Prat, Lindsey. “The Research Risk Cascade: Why Even ‘90% Accurate’ AI Tools Break Pipelines.” lindseydewittprat.com, January 2, 2026. https://www.lindseydewittprat.com/research-risk-cascades
This work is licensed under CC BY 4.0.